Honor Roll
Only three states passed the pandemic makeup exam. Yours probably didn’t.
No state is back on all four tests, kids at the bottom recovered only in those three, and the top-to-bottom gap grew in every state and DC, honor roll included.
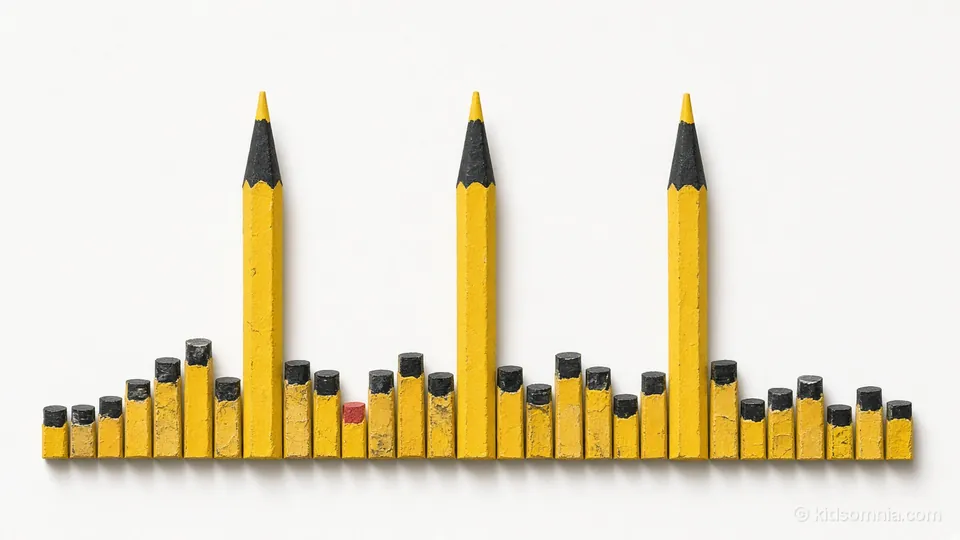
Three states finished pandemic summer school. The rest were held back.
Only Louisiana and Alabama, and Hawaii by a hair, are back at their 2019 level on the Nation’s Report Card, and no state is back on all four of its tests. Mississippi gets honorable mention, still below 2019 and clearly ahead of the nation. Thirty-nine other states and the District of Columbia fell about as far as the nation did, and seven states fell clearly further, which earns them the back row of summer school.
No state grades its own paper here. The report card is NAEP, the National Assessment of Educational Progress, run by the National Center for Education Statistics (NCES). It asks the same questions in every state in reading and math at grades 4 and 8, and its latest state results are from 2024.
The marks read like this. A −0.14, the nation’s figure on both change and level, means the typical student of 2024 stands where the 44th-percentile student of 2019 stood, down from the 50th. The change and level columns all read that way, in standard deviations explained below the table. Zero on change means level with 2019, and zero on level means the average U.S. public school student of 2019. The tests column counts how many of the four are statistically below, level with or above 2019.
Three states are level with 2019, one more is clearly ahead of the nation, and seven are clearly behind it.
| State | Rank | Tier | Change since 2019 | Tests below/level/above | 2024 level |
|---|---|---|---|---|---|
| Louisiana | 1 | 1 Back at 2019 | +0.03 | 1/2/1 | −0.19 |
| Alabama | 2 | 1 Back at 2019 | −0.01 | 1/2/1 | −0.27 |
| Hawaii | 3 | 1 Back at 2019 | −0.04 | 1/3/0 | −0.13 |
| Mississippi | 4 | 2 Below, ahead of U.S. | −0.07 | 1/3/0 | −0.14 |
| Tennessee | 5 | 3 Below, with U.S. | −0.08 | 1/3/0 | −0.08 |
| South Carolina | 6 | 3 Below, with U.S. | −0.09 | 2/2/0 | −0.18 |
| Illinois | 7 | 3 Below, with U.S. | −0.09 | 1/3/0 | −0.09 |
| District of Columbia | 8 | 3 Below, with U.S. | −0.10 | 3/1/0 | −0.33 |
| Colorado | 9 | 3 Below, with U.S. | −0.11 | 2/2/0 | 0.00 |
| Rhode Island | 10 | 3 Below, with U.S. | −0.11 | 3/1/0 | −0.14 |
| Montana | 11 | 3 Below, with U.S. | −0.11 | 3/1/0 | −0.05 |
| Kentucky | 12 | 3 Below, with U.S. | −0.11 | 2/2/0 | −0.12 |
| New Hampshire | 13 | 3 Below, with U.S. | −0.11 | 3/1/0 | +0.03 |
| Utah | 14 | 3 Below, with U.S. | −0.12 | 3/1/0 | +0.01 |
| California | 15 | 3 Below, with U.S. | −0.12 | 2/2/0 | −0.23 |
| South Dakota | 16 | 3 Below, with U.S. | −0.12 | 3/1/0 | −0.05 |
| Iowa | 17 | 3 Below, with U.S. | −0.12 | 3/1/0 | −0.10 |
| Indiana | 18 | 3 Below, with U.S. | −0.12 | 3/1/0 | −0.01 |
| Georgia | 19 | 3 Below, with U.S. | −0.12 | 1/3/0 | −0.16 |
| North Dakota | 20 | 3 Below, with U.S. | −0.12 | 3/1/0 | −0.05 |
| Wyoming | 21 | 3 Below, with U.S. | −0.13 | 4/0/0 | +0.01 |
| Wisconsin | 22 | 3 Below, with U.S. | −0.13 | 3/1/0 | −0.03 |
| Nevada | 23 | 3 Below, with U.S. | −0.13 | 3/1/0 | −0.25 |
| Arkansas | 24 | 3 Below, with U.S. | −0.14 | 3/1/0 | −0.28 |
| Texas | 25 | 3 Below, with U.S. | −0.14 | 2/2/0 | −0.18 |
| Ohio | 26 | 3 Below, with U.S. | −0.14 | 3/1/0 | −0.05 |
| New York | 27 | 3 Below, with U.S. | −0.14 | 2/2/0 | −0.17 |
| Massachusetts | 28 | 3 Below, with U.S. | −0.15 | 3/1/0 | +0.14 |
| Kansas | 29 | 3 Below, with U.S. | −0.16 | 3/1/0 | −0.15 |
| Idaho | 30 | 3 Below, with U.S. | −0.16 | 4/0/0 | −0.06 |
| Washington | 31 | 3 Below, with U.S. | −0.16 | 3/1/0 | −0.11 |
| Connecticut | 32 | 3 Below, with U.S. | −0.17 | 4/0/0 | −0.03 |
| North Carolina | 33 | 3 Below, with U.S. | −0.17 | 3/1/0 | −0.13 |
| Alaska | 34 | 3 Below, with U.S. | −0.17 | 3/1/0 | −0.44 |
| New Jersey | 35 | 3 Below, with U.S. | −0.17 | 3/1/0 | +0.05 |
| West Virginia | 36 | 3 Below, with U.S. | −0.17 | 3/1/0 | −0.38 |
| Maryland | 37 | 3 Below, with U.S. | −0.18 | 4/0/0 | −0.18 |
| Michigan | 38 | 3 Below, with U.S. | −0.18 | 3/1/0 | −0.22 |
| Pennsylvania | 39 | 3 Below, with U.S. | −0.18 | 4/0/0 | −0.09 |
| Missouri | 40 | 3 Below, with U.S. | −0.18 | 4/0/0 | −0.20 |
| Arizona | 41 | 3 Below, with U.S. | −0.19 | 4/0/0 | −0.25 |
| Minnesota | 42 | 3 Below, with U.S. | −0.19 | 4/0/0 | −0.03 |
| Nebraska | 43 | 3 Below, with U.S. | −0.20 | 4/0/0 | −0.11 |
| Florida | 44 | 3 Below, with U.S. | −0.20 | 3/1/0 | −0.13 |
| New Mexico | 45 | 4 Below, behind U.S. | −0.22 | 4/0/0 | −0.52 |
| Oklahoma | 46 | 4 Below, behind U.S. | −0.23 | 4/0/0 | −0.33 |
| Vermont | 47 | 4 Below, behind U.S. | −0.23 | 4/0/0 | −0.15 |
| Virginia | 48 | 4 Below, behind U.S. | −0.24 | 4/0/0 | −0.13 |
| Delaware | 49 | 4 Below, behind U.S. | −0.25 | 4/0/0 | −0.31 |
| Oregon | 50 | 4 Below, behind U.S. | −0.26 | 4/0/0 | −0.30 |
| Maine | 51 | 4 Below, behind U.S. | −0.26 | 4/0/0 | −0.22 |
Source: NCES NAEP Data Explorer, public school results for 2019 and 2024, with our calculation.
Every number behind this table, including raw scores and standard errors, is in the data file, one row per state.
How we scored it. For each test we took the state’s 2024 average minus its 2019 average and divided by the spread of scores among U.S. public school students in 2019, then averaged the four results with equal weight. The tiers come from the standard errors NCES publishes, adjusted for comparing 51 places at once with the false discovery rate procedure NAEP itself uses. One assumption is ours. Math and reading samples in a grade share schools, so we treat their errors as correlated at 0.5. Lower that to 0.3 and one state changes tier: Hawaii drops from the first to the second.
Five lost points weigh more in grade 4 math than in grade 8
NAEP builds a separate scale for each subject, and NCES says flatly that results cannot be compared across subjects. Scores also spread out differently from test to test. In 2019, the standard deviation among U.S. public school students was 32 points in grade 4 math and 40 points in grade 8 math. A standard deviation is the usual measure of spread, and about two-thirds of students fall within one of the average.
So a raw point cannot be the unit. We measure each state’s change as a share of that test’s own spread, which makes a 5-point drop worth 0.16 in grade 4 math and 0.13 in grade 8 math. NCES uses the same yardstick in its technical work and publishes no combined recovery score, so the combined number here is ours.
In plainer terms, line up all U.S. public school students from 2019, and the one in the exact middle is at the 50th percentile. On that line the typical student of 2024 stands at roughly the 44th in the nation, the 56th in Massachusetts and the 30th in New Mexico. That translation is the same conversion federal evidence reviewers use.
NAEP is a series of cross-sectional studies, which means a new sample each time and no child followed from test to test. So “recovered” means the fourth graders of 2024 match the fourth graders of 2019. Those 2024 fourth graders, tested between January and March 2024, were in kindergarten in spring 2020. The eighth graders were in fourth grade. No child’s own progress appears anywhere in these numbers.
Iowa at 17 and Indiana at 18 are a coin flip, so skip the bragging and read the tier
Iowa ranks 17th and Indiana 18th. Given their error bars, the chance that Iowa’s true change beats Indiana’s is 52 percent, and a ranking that stops at the rank is judging a horse race from the parking lot.
Redraw all 51 results 20,000 times from their error bars and Ohio, ranked 26th, lands between 7th and 41st in 95 percent of the draws. The typical state’s range covers 28 places. Louisiana (1st to 3rd) and Maine (43rd to 51st) are the tight ones. The spread comes from sample size. NAEP tested about 2,200 students per test in the average state in 2024, so every state average carries sampling error, measured by a number called the standard error. A difference counts as statistical when it is larger than those errors can easily produce, and NCES warns that a numerically higher score may not be a statistically higher one.
So read the tier first. The four work like this:
- 1 Back at 2019. The state’s likely range of change includes zero.
- 2 Below, ahead of U.S. Clearly better than the nation’s change.
- 3 Below, with U.S. Impossible to separate from the nation’s change.
- 4 Below, behind U.S. Clearly worse than the nation’s change.
Hawaii is the closest call on the page. Its likely range, the 95 percent interval, runs from −0.09 to just above zero, and that top edge depends on our 0.5 assumption. Tennessee, South Carolina, Florida and Nebraska sit near the other lines. Each clears the unadjusted test against the nation and misses the adjusted one, so all four stay in the third tier.
The tests column answers a narrower question with NCES’s own result for each state and test. That is the usual statistical test of two years, using the standard errors of both, with no adjustment for making 204 comparisons. Apply the adjustment and 3 of the 151 results that differ from 2019 disappear, grade 4 reading in Tennessee and Maryland and grade 8 math in Utah. Tennessee would then be level on all four, the only state that could say so. “None on all four” holds on NCES’s own test, by that one result.
Grade 8 math holds back 50 of 51, and fourth grade outran eighth in 43
Louisiana and Alabama are the only states above 2019 on any test, Alabama in grade 4 math and Louisiana in grade 4 reading. That is 2 results out of 204. Another 53 are level and 149 are below.
Source: NCES NAEP Data Explorer, 2019 and 2024, NCES significance test.
Only Tennessee is level in grade 8 math, which means all three states in the top tier are still below 2019 on that test.
After adjustment the grade 4 advantage is clear in five states (Alabama, Louisiana, South Carolina, West Virginia and Florida), and grade 8 clearly wins nowhere. Alabama’s two grades point in opposite directions, +0.12 in grade 4 and −0.14 in grade 8, so its ranking says little to the parent of an Alabama eighth grader. Remove grade 4 math from the average and Alabama falls to fourth.
Math and reading mostly move together within a state. Only four places show a clear split after adjustment. Reading held up better than math in DC, Alaska and New Mexico, and math held up better in Nebraska.
Momentum is narrower than “recovery” suggests. From 2022 to 2024, 13 states and DC gained in grade 4 math. On the other three tests no state gained at all, and 17 results fell. Nor was 2019 a high-water mark, since all four national scores were already statistically below their 2013 levels. Getting back to 2019 means getting back to a year that was already sliding.
Alabama ranks 2nd on the way back and 43rd on where it stands
A state can gain from a low base or slip from a high one, so read the last column too. Louisiana is 1st on change and 36th on level. Massachusetts is 28th on change and 1st on level at +0.14, the only state clearly above the average student of 2019. It lost ground and kept first place, the way a house that loses a wing can still be the biggest on the block. New Jersey is 35th on change and 2nd on level. New Mexico is 45th on change and last on level at −0.52.
Is any state high on both? By a strict test, no. No state is both clearly above the nation on level and clearly ahead of it on change. Tennessee comes closest, clearly above on level and ahead on change until the adjustment is applied. Loosen the test to the top third of both lists and you get Colorado, Montana, New Hampshire, South Dakota, Tennessee and Utah.
Delaware, Maine, New Mexico, Oklahoma and Oregon are low on both by the strict test, clearly below the nation on level and clearly behind it on change.
Virginia stood 8th on level in 2019 and stands 23rd in 2024, and its students now land at about the national average. Hawaii made the largest climb on level, from 40th to 26th, and the usual telling of this story leaves it out. Mississippi, with the highest child poverty rate in the country in 2019, now sits at −0.14, the same as the nation.
For scale, the Department of Defense schools, which NAEP reports alongside the states and we do not rank, are at +0.38 with no test below 2019. No state can claim either number.
We also checked whether the leaders got there by leaving students out. NAEP publishes the share of sampled students excluded among students with disabilities and English learners. In Louisiana, Alabama and Hawaii it rose by about one percentage point at most on any test, and in Mississippi from 1 percent to 3 on both reading tests. Massachusetts earns a footnote, at 5 to 6 percent on three of its four tests in 2024, up from 2 to 3 percent in 2019.
Poverty predicts where a state stands and barely predicts how far it fell
Take each state’s 2019 child poverty rate from the Census Bureau. It explains about 28 percent of the state-to-state difference in the 2024 level, a correlation of −0.53 on a scale where 0 means no link and 1 or −1 means lockstep. It explains about 9 percent of the difference in change, and it points the unexpected way (+0.30), with higher-poverty states falling slightly less. NAEP’s own count of tested students from low-income families, eligible for free or reduced-price lunch under the older label, tells the same story at 38 percent and 2 percent, though each state has defined that status itself since 2015.
Mississippi and New Mexico had two of the three highest rates in 2019, 26 and 22 percent, and their changes are −0.07 and −0.22. New Hampshire had the lowest, under 8 percent, and its −0.11 falls between them.
The data cannot say why. NCES itself says that “NAEP is not designed to identify the causes of change in student performance.” That goes for every explanation you will hear for Louisiana, Alabama or anywhere else.
Students at the bottom are back only in Louisiana, Alabama and Hawaii
We ran the same calculation at the 90th percentile, a student who outscores 90 percent of the state’s students, and at the 10th. Nationally the 90th percentile is down 0.05, a small drop but a clear one, and the 10th is down 0.26.
The student at the 10th percentile is level with 2019 in three states, the same three at the top of the table. At the 90th, the country is measurably down, yet 37 states cannot be told apart from 2019, or 44 once the adjustment is applied. State samples are too small to see a drop that size, and only seven sit at or above zero on paper. The distance between the two grew in all 51, clearly so in 28 after adjustment.
Virginia has the largest drop at the 10th percentile, −0.44, against −0.10 at the 90th. In DC the 90th percentile is up 0.08 on paper while the 10th is down 0.24. Massachusetts, first on level, is down 0.30 at the 10th and 0.03 at the 90th. A state’s single number can be fair as an average and wrong for your child, in either direction.
The next report card arrives in early 2027, on a changed test
NCES says the 2026 reading and math results are scheduled for early 2027, with state and urban district results. Until then, 2024 is the newest state data there is, which is why this table is the one to know now. It is also the last state table on the old frameworks, the documents that guide the questions students answer. NCES says 2026 is the first test under new frameworks, most schools may use their own devices, and reading adds automated scoring. NCES says it will run a study to confirm that score changes reflect what students know rather than the device or the framework, and that the extra analysis is why results take until 2027. When they come out, this table gets rebuilt at this same address.
The Nation’s Report Card never names your child’s school. Your district’s card must.
NCES is plain that NAEP does not report scores for individual schools or their students. Your state’s NAEP history is in State Profiles, and the 26 large urban districts tested in 2024 have their own in District Profiles. Everyone else needs the state test, which cannot be compared with other states and can be compared over time within one.
Federal school-aid law gives you the route. Each state’s education agency must post the state report card and every district’s report card on a single webpage, and each district’s card must cover each of its schools, with state test results at each achievement level. NCES lists the state agencies.
Your state’s row says how many tests are below 2019, and the data file names them, in the columns ending in nces_result. In Alabama that is grade 8 math. In Virginia it is all four, starting with the lowest-scoring students. Find your school’s page, note the share of students at the lowest achievement level, and put this to the principal.
What share of students in my child’s grade scored at the lowest level on last spring’s state reading and math tests, what was that share in spring 2019, and what is the school doing this year for those students specifically?
If the state changed its test since 2019, the principal should say so, and the comparison starts at the new test’s first year. Write the two shares side by side in red pen. That is the one makeup exam in this story that names your child’s school.
The tables we built and the calculations we ran on this page are free to reuse under Creative Commons Attribution 4.0: credit Kidsomnia and link here. Government figures inside them stay under the agency’s own terms.
Add Kidsomnia as a preferred source on Google
Kate Smith, the founding editor, answers for every line. Found a mistake? Tell us and we will fix it in public.