The Curve
Public schools lost 1.4 million students. We took attendance.
Everyone has a villain. The roll shows three-quarters of the loss in one fall, and kindergarten classes through fall 2030 already born and already smaller.
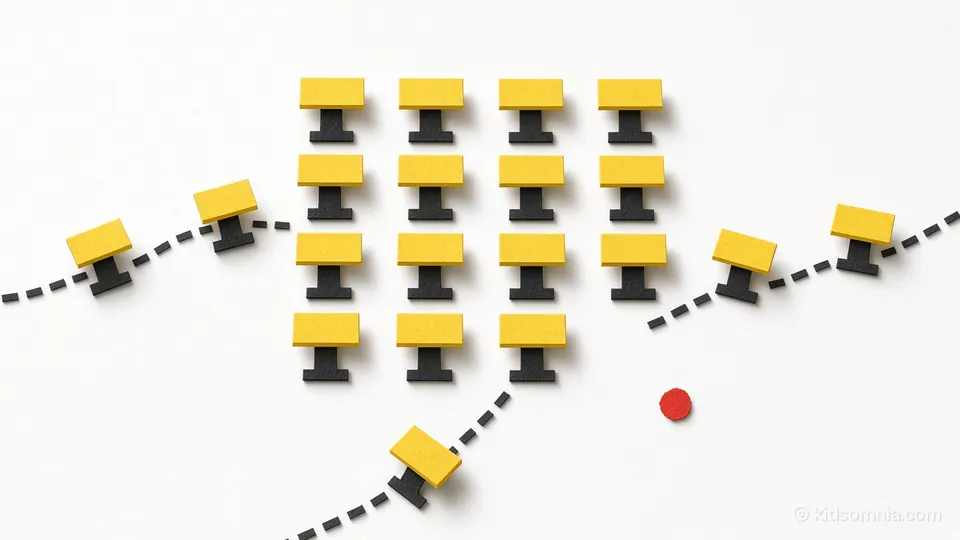
Unexcused absence, 130,752 students. No note in the federal files.
Of the students public schools lost between 2019 and 2024, about 630,000 reflect a smaller school-age population, about 750,000 match gains at private schools and in homeschooling, and about 130,000 are absent with no note. That last group is the leftover the federal files cannot place, too small to tell from zero.
The three groups add up to 1.51 million, more than the 1.42 million on the federal count, because California’s transitional kindergarten, a public grade for 4-year-olds, grew by 88,670 over those years. Those children sit outside the Census age group we compare against, so they come off the roll.
Fewer children and other schooling account for all but 130,752 of the 1,513,004 students to explain, and the margin is wider than what is left.
| Line | Students | Margin |
|---|---|---|
| Public schools lost, as counted, fall 2019 to fall 2024 | 1,424,334 | a count |
| Loss to explain, 2019-20 to 2024-25, with California’s 88,670 added 4-year-olds taken out | 1,513,004 | a count |
| Fewer children ages 5 to 17, July 2019 to July 2024 | 630,791 | none published |
| More private school students, fall 2019 to fall 2023 | 443,461 | ±94,693 |
| More homeschooled students, spring 2019 to spring 2023 | 308,000 | ±279,083 |
| Accounted for | 1,382,252 | ±294,711 |
| Still unexplained | 130,752 | ±294,711 |
Source: National Center for Education Statistics (NCES) Common Core of Data, the federal school census and no relation to the Common Core standards, K-12; California Legislative Analyst’s Office and California Department of Finance for the 4-year-olds; Census Bureau 2010-2020 estimates and 2025 release; NCES private school survey; NCES household survey; our calculation.
How we calculated it. Every row leaves out pre-K, which puts fall 2024 at 47,786,390 students, and California’s 88,670 rests on a rounded state figure for 2019-20, so trust it to the nearest hundred. Margins are 95 percent ranges built from the sampling errors NCES publishes, and the Census Bureau publishes none for its estimates. The Census Bureau restarted its count at April 2020, and the new starting point for ages 5 to 17 sits 119,261 below the 2020 Census figure the older series ends on. We subtract the two official series as published. Joined at April 2020 instead, fewer children comes to 511,530, and the stress test below runs that version too. The private and homeschool rows stop in 2023 because those surveys have nothing newer, and stopping every row at fall 2023 shrinks the leftover to 31,173.
On those margins alone, the leftover runs from an overshoot of about 164,000 to a shortfall of about 425,000, before any error in the Census estimate. Children enrolled nowhere are the best candidate, up about 76,000 on the Census Bureau’s household survey.
The ledger prices the two usual explanations. Fewer kids comes to 42 percent of the loss. Families leaving comes to 50 percent, give or take 20 points, and only if every private school and homeschool gain counts as a departure. Neither wins outright, and the more useful finding is on the calendar.
Three-quarters of the loss happened in one fall, 2020
Public schools dropped from 90.1 students per 100 children to 88.3 in fall 2020, and that figure has barely moved since.
| Fall | Public schools | Children 5 to 17 | What births alone predict | Public students per 100 children |
|---|---|---|---|---|
| 2019 | +56,649 | +26,795 | −37,857 | 90.1 |
| 2020 | −1,077,946 | −68,915 | −43,229 | 88.3 |
| 2021 | −110,619 | −258,396 | −144,075 | 88.5 |
| 2022 | +68,107 | −140,857 | −256,552 | 88.8 |
| 2023 | −147,926 | −80,173 | −346,637 | 88.7 |
| 2024 | −155,950 | −82,450 | −518,015 | 88.6 |
Source: the same federal files, each row against the year before, public count as reported; CDC birth counts; our calculation. The 2020 children’s figure crosses the Census Bureau’s restart, and joined at April 2020 it reads +50,346.
The births column is a plain subtraction, the babies born five years earlier who enter kindergarten minus the babies born 18 years earlier who finish twelfth grade.
Fall 2020 alone is 76 percent of the counted loss, and births explain 43,229 of its 1,077,946. The drop sat in the youngest grades. Kindergarten through grade 7 lost 1,167,308 students that fall, about 830,000 more than birth years alone would take out. Grades 8 through 12 gained 91,642, about 203,000 short of the bigger birth years arriving there, and kindergarten regained 176,506 a year later.
From fall 2021 to fall 2024, with California’s added 4-year-olds left out, public schools lost 337,839 students and the child population fell by 303,480.
Both stories fit. They describe different years.
One bad fall still does not close the file. Outside California, whose kindergarten line includes those 4-year-olds, kindergarten enrollment was 91.6 percent of births five years earlier in fall 2019 and 89.0 percent in fall 2024.
Public schools lost over a million by fall 2021, and private schools gained 78,399
Private schools gained 78,399 students between fall 2019 and fall 2021, give or take 67,919, while public schools lost more than a million. Where the rest went is the hardest question in these files, because the federal homeschool survey ran in 2019 and 2023 and has nothing between.
The American Community Survey, the Census Bureau’s big household survey, does have a 2021 reading. The share of children 5 to 17 in a private school or homeschool, a single box on the form, rose from 10.9 percent in 2019 to 12.8 percent. The share enrolled in no school rose from 3.2 percent to 4.3 percent, then fell back to 3.4 percent by 2023.
Private schools’ big gain came later, 365,062 students between fall 2021 and fall 2023, give or take 77,769, while public schools, with California’s added 4-year-olds left out, lost about 156,000 and the child population fell by 221,030. That leaves about 430,000 children to find outside the public and private rows. Most look like children who were in no school at all in 2021, since the “no school” count fell by about 510,000 over those years. Two surveys on different calendars will not match to the student, so treat it as a direction.
None of these surveys follows a child, so they cannot show a family leaving a public school in 2020 and turning up at a private one in 2022. The timing does rule out the simple version, where the public losses of fall 2020 were already private gains by fall 2021.
The 5.2 percent you keep hearing cannot go in this ledger
The federal figure for children getting instruction at home is 5.2 percent in 2022-23, up from 3.7 percent in 2018-19. Homeschooled students are 3.4 percent, and 0.7 of that takes every course online. The other 1.8 percent also take every course online, but their parents do not call it homeschooling, so NCES places them in public or private schools. They supply 0.9 of the 1.5-point rise. Add the 5.2 percent here and you count them twice, and our online school piece sorts out who they are.
The homeschool row rests on an estimate that swings. The federal figure was 1,773,000 in 2012, 1,690,000 in 2016 and 1,457,000 in 2019, so 1,765,000 in 2023 only returns it to 2012’s level, the same 3.4 percent. NCES itself warns that changes in the survey’s methods and wording call for caution across these years. With the margin, the rise since 2019 could be about 29,000 or about 587,000.
We tried to break the ledger, and the leftover swung by about a million
A ledger that closes this neatly deserves suspicion, so we tried to break it.
Fewer children stay under half of the loss in every version, while the leftover swings by about a million students.
| Version | Fewer children | Private and home | Left over |
|---|---|---|---|
| The ledger above | 630,791 | 751,461 | 130,752 |
| The same 2025 release, joined at April 2020 | 511,530 | 751,461 | 250,013 |
| The previous release, joined at April 2020 | 369,674 | 751,461 | 391,869 |
| Start before private schools’ 2019 dip | 617,903 | 273,211 | 625,517 |
| Household survey for private and home | 630,791 | 1,302,255 | −420,042 |
Source: the files above, the 2017-18 private school survey and the American Community Survey; our calculation. Rows two and three join a Census release to the older series at April 2020. Row four starts in 2016 or 2017, depending on the survey, and assumes California’s 4-year-olds held level from 2017 to 2019. A minus means the rows overfill the loss.
The Census Bureau publishes no margin, so its revisions are the best guide to its error. Its estimate for July 2024 moved by 569,262 children between one release and the next, mostly from rebuilding its April 2020 starting point, and that one revision is larger than the whole private school row.
Private schools were shrinking before the pandemic, down 245,250 students between fall 2017 and fall 2019, give or take 136,536, so a ledger starting in 2019 may start in a dip. That 2019 count is also the shakiest of the private school surveys here. NCES canceled its field follow-up over pandemic safety concerns and finished with a 73.3 percent response rate. Start earlier and the leftover clears its margin of 345,811.
The household survey sees no such dip, and its private-or-home share, 13.4 percent in 2024, overfills the ledger. Parents of virtual students may be ticking that box, and the published tables give no way to test it.
Two things survive every version. Fewer children stay between 24 and 42 percent of the loss, and the fall 2020 drop is a count, so no choice of survey moves it.
No more than about 4 in 10 of the lost students reflect fewer children in any version here. The rest, 882,213 or more, are children the Census Bureau estimates still live here and who are counted somewhere else or nowhere.
Florida and Texas gained children far faster than their public schools did
Public schools here run fall 2019 to fall 2024, K-12, and children run July 2019 to July 2024. “Schools trail children” means the child count held steady or rose while the public count fell behind, and those children may be in private school, at home, in no school or in a Census estimate that runs high. “Fewer children” means public schools fell about as far as children did. “Mostly fewer children” and “Mostly trailing” mean both happened and name the bigger part. “Holding” means public schools grew and kept pace with children.
Fewer children lead the loss in 25 states, the gap leads in 21 states and DC, and 4 states are holding.
| State | Public schools | Children 5 to 17 | Difference | Difference, % of 2019 students | Reading |
|---|---|---|---|---|---|
| Alabama | +5,006 | +6,303 | −1,297 | −0.2% | Holding |
| Alaska | −1,745 | −2,868 | +1,123 | +0.9% | Fewer children |
| Arizona | −46,879 | +1,537 | −48,416 | −4.3% | Schools trail children |
| Arkansas | −5,520 | +3,653 | −9,173 | −1.9% | Schools trail children |
| California | −446,161 | −356,136 | −90,025 | −1.5% | Mostly fewer children |
| Colorado | −45,570 | −35,383 | −10,187 | −1.2% | Mostly fewer children |
| Connecticut | −17,570 | −21,565 | +3,995 | +0.8% | Fewer children |
| Delaware | +1,709 | +2,347 | −638 | −0.5% | Holding |
| District of Columbia | +5,180 | +9,174 | −3,994 | −5.2% | Schools trail children |
| Florida | +5,212 | +164,809 | −159,597 | −5.7% | Schools trail children |
| Georgia | −24,321 | +6,001 | −30,322 | −1.8% | Schools trail children |
| Hawaii | −13,996 | −12,097 | −1,899 | −1.1% | Mostly fewer children |
| Idaho | +4,392 | +13,969 | −9,577 | −3.1% | Schools trail children |
| Illinois | −103,202 | −121,416 | +18,214 | +1.0% | Fewer children |
| Indiana | −15,905 | −2,583 | −13,322 | −1.3% | Mostly trailing |
| Iowa | −10,390 | −7,551 | −2,839 | −0.6% | Fewer children |
| Kansas | −17,303 | −14,192 | −3,111 | −0.7% | Fewer children |
| Kentucky | −27,904 | +27 | −27,931 | −4.2% | Schools trail children |
| Louisiana | −39,845 | −24,118 | −15,727 | −2.3% | Mostly fewer children |
| Maine | −13,194 | −4,979 | −8,215 | −4.7% | Mostly trailing |
| Maryland | −17,751 | −12,496 | −5,255 | −0.6% | Fewer children |
| Massachusetts | −44,387 | −38,693 | −5,694 | −0.6% | Fewer children |
| Michigan | −78,260 | −57,297 | −20,963 | −1.4% | Mostly fewer children |
| Minnesota | −20,916 | −6,854 | −14,062 | −1.6% | Mostly trailing |
| Mississippi | −37,621 | −21,303 | −16,318 | −3.6% | Mostly fewer children |
| Missouri | −23,989 | −4,023 | −19,966 | −2.3% | Mostly trailing |
| Montana | −4,038 | +4,011 | −8,049 | −5.4% | Schools trail children |
| Nebraska | +524 | +436 | +88 | +0.0% | Holding |
| Nevada | −20,900 | +2,666 | −23,566 | −4.9% | Schools trail children |
| New Hampshire | −13,069 | −10,845 | −2,224 | −1.3% | Mostly fewer children |
| New Jersey | −36,583 | −23,587 | −12,996 | −1.0% | Fewer children |
| New Mexico | −24,754 | −23,109 | −1,645 | −0.5% | Fewer children |
| New York | −162,555 | −163,068 | +513 | +0.0% | Fewer children |
| North Carolina | −14,232 | +30,374 | −44,606 | −2.9% | Schools trail children |
| North Dakota | +3,706 | +5,070 | −1,364 | −1.2% | Schools trail children |
| Ohio | −29,803 | −31,888 | +2,085 | +0.1% | Fewer children |
| Oklahoma | −1,177 | +12,576 | −13,753 | −2.1% | Schools trail children |
| Oregon | −37,573 | −26,982 | −10,591 | −1.8% | Mostly fewer children |
| Pennsylvania | −40,100 | −50,192 | +10,092 | +0.6% | Fewer children |
| Rhode Island | −8,007 | −9,595 | +1,588 | +1.1% | Fewer children |
| South Carolina | +11,045 | +30,511 | −19,466 | −2.6% | Schools trail children |
| South Dakota | +1,161 | +5,233 | −4,072 | −3.0% | Schools trail children |
| Tennessee | −11,019 | +29,331 | −40,350 | −4.1% | Schools trail children |
| Texas | +49,378 | +201,291 | −151,913 | −2.9% | Schools trail children |
| Utah | +445 | −1,691 | +2,136 | +0.3% | Holding |
| Vermont | −4,320 | −4,827 | +507 | +0.7% | Fewer children |
| Virginia | −39,474 | −11,098 | −28,376 | −2.2% | Mostly trailing |
| Washington | −36,155 | −14,313 | −21,842 | −2.0% | Mostly trailing |
| West Virginia | −19,197 | −11,367 | −7,830 | −3.2% | Mostly fewer children |
| Wisconsin | −40,391 | −31,404 | −8,987 | −1.1% | Mostly fewer children |
| Wyoming | −4,986 | −2,590 | −2,396 | −2.5% | Mostly fewer children |
Source: NCES Common Core of Data, K-12; Census Bureau 2010-2020 estimates and 2025 release; our calculation.
How we calculated it. A gap within 1 percent of a state’s fall 2019 students counts as no gap, which is our own line. California’s row leaves out its added 4-year-olds, and with them in, its gap all but disappears. Joining the Census series at April 2020 changes two labels, New Jersey and Wyoming, and the data file adds that version and each state’s private school change with its margin.
Eleven places have more public students than in fall 2019, and in ten of them the Census Bureau also estimates more children. Only four of them, Alabama, Delaware, Nebraska and Utah, kept pace. Texas gained 49,378 students and 201,291 children, and Florida gained 5,212 and 164,809. Those two hold 35 percent of the national gap. California and New York sit at the other end, with 82 percent of the net drop in children.
Private schools fill some gaps and leave others alone. North Carolina’s gap is 44,606, with 30,061 more private students through fall 2023, give or take 2,888. Florida’s is 159,597, with 91,420 more, give or take 28,283. Tennessee’s is 40,350 and Kentucky’s is 27,931, and their private school estimates did not measurably move. The federal homeschool survey has no state counts, so that part stays dark.
Every row carries three limits. A state’s “fewer children” includes families who moved to another state, so some of California’s loss may be Texas’s gain, and these Census files do not split births from moves. Arrival estimates matter most where growth is fastest, and the latest revision alone moved Florida’s child gain by about 37,000. A quiet row can also hide traffic both ways. Pennsylvania and Ohio show almost no gap, yet the household survey has their private-or-home share up 2.8 points, with a margin under 1 point.
Vouchers, public money for private tuition, get named as a cause, and so do remote work, housing costs and immigration. Totals like these cannot test any of them.
Births alone take another 2.8 million students out of K-12 by fall 2030
Kindergartners of a given fall were born about five years earlier, so CDC birth counts already set the starting size of every entering class through fall 2030. The largest class in these counts, 4,316,233 babies born in 2007, finished high school around 2025, and the 3,613,647 born in 2020 replaced it.
Source: CDC National Center for Health Statistics, births through 2023 and 2024 and 2025; our calculation.
Arrivals soften this, and by a lot. From July 2020 to July 2024, births lined up to those dates said about 1.03 million fewer children and the Census Bureau estimated 561,876 fewer, so people arriving minus deaths softened the drop by about 470,000 in four years. Hold that pace, which is an assumption and nothing more, and the six-year drop is about 2.1 million instead of 2,817,749.
How we calculated it. A child who is 5 on July 1 was born between one July and the next June, so each July-to-July step takes half of two calendar years’ births, at both ends of the age range.
The last federal projection, built on data through fall 2021, has public schools, pre-K included, at 46.9 million by fall 2031, against 49.4 million in fall 2024.
Fall 2025 and fall 2026 have already happened, and their federal counts are not out. The Census estimate for July 2025 is 434,663 children lower, the biggest one-year drop in this data, and the household survey released October 29, 2026 puts the private-or-home share at 14.1 percent in 2025, up from 13.4 percent a year earlier. High school parents should note the turn. Grades 9 through 12 gained 292,432 students over the five years while K-8 lost 1,640,446 and the ungraded count fell 76,320. High school peaked in fall 2023 at 15,547,595, and the drop now reaches them.
That count is also a budget. Every state’s school funding formula counts students, and many states cushion a drop, yet California’s Legislative Analyst’s Office wrote in 2026 that lower funding from falling enrollment often leaves districts needing to “downsize programs or close school sites.”
Kindergarten minus grade 12 shows your district’s built-in drop, before anyone moves
The NCES district lookup gives your district’s ID and one year of students. For the history, open the NCES table generator, choose District as the row and pick 2019-20 through 2024-25 as the years. On the Enrollments tab, select “Total Students, All Grades (Excludes AE)”, Kindergarten Students and Grade 12 Students. AE is adult education, and that total includes pre-K, which our rows leave out. Filter to your state, create the table and export it.
Then subtract grade 12 from kindergarten in the latest year. That gap between the class arriving and the class leaving is the change already built in, before anyone moves. The country’s fall 2024 figure is 327,282 fewer students, with 3,478,906 kindergartners, California’s 4-year-olds among them, against 3,806,188 seniors. Look for charter schools, public schools run outside the district’s direct control, before you draw conclusions, because some report as their own agency in the federal data, and a district can shrink while its students stay public a few streets away.
Now make your own forecast for one fall. Children starting kindergarten in fall 2030 were born around 2025, and U.S. births that year ran 3.6 percent below 2019, the matching year for fall 2024’s kindergartners. Outside California, whose line includes the 4-year-olds, multiply your district’s fall 2024 kindergarten count by 0.964. That is the country’s birth count applied to your town, before anyone moves in or out.
Set it beside the fall 2030 line in your school board’s latest published enrollment forecast, if it has one. A forecast above your number is counting on families moving in or coming back. Make it show its work, starting with how many.
Are charter school students in these public school numbers?
Charter students are inside every public row on this page, 3,431,230 of them in fall 2019 and 3,717,857 in fall 2022 on the federal school-level count, pre-K included. District-run schools therefore lost more students than the public row shows.
Why does this page say 47.8 million students when the federal headline for fall 2024 is 49.4 million?
Pre-K is the 1.6 million difference. We leave it out of every row because California left its pre-K line blank in the federal file for fall 2019 and fall 2024, and because the Census comparison starts at age 5.
The tables we built and the calculations we ran on this page are free to reuse under Creative Commons Attribution 4.0: credit Kidsomnia and link here. Government figures inside them stay under the agency’s own terms.
Add Kidsomnia as a preferred source on Google
Kate Smith, the founding editor, answers for every line. Found a mistake? Tell us and we will fix it in public.